CloudWatch
CloudWatch Overview:
- Performance monitoring, alarms, log collections and automated remediation.
- Used to collect performance metrics (AWS and On-prem), event driven responses, improve performance and resource optimisation and operational visibility with logs.
CloudWatch Features:
- Metrics
- Alarm
- Logs
- Events
CloudWatch Metrics:
- Metrics are sent from many services.
- EC2 for example are sent every 5 mins (free).
- This can be changed to every minute for a cost.
- CloudWatch Agent required for system level metrics (Memory/Disk).
- Can also publish custom metrics: Standard Resolution: 1 Min, High Res: 1 sec.
- Metrics exist within a region, cannot be deleted, expire after 15 months (default).
- Metrics are uniquely defined by: Name, Namespace and zero or more dimensions.
- Timestamps are two weeks in the past to two weeks in the future.
- Metric retention depends on data period length:
- <60 seconds = Retained for 3 hours, 60 seconds = 15 day retention, 300 seconds = 63 Day retention and 3600 seconds = 455 Days retention.
CloudWatch Alarm:
- Metric Alarm performs an action based on single metric.
- Composite Alarm rule expression includes multiple alarms.
- Can create custom alarm using 'set-alarm-state' API/CLI Command.
- Metric Alarm States: OK, Alarm and Insufficient_Data.
Namespaces:
- A namespace is simply a container for metrics of different services.
- Metrics in different namespaces are isolated.
- Namespace for each data point you publish must be specified.
Dimensions:
- A way to further categorise a namespace.
- Key-Value pairs.
- Up to 10 dimensions for a metric.
- Dimensions are categories that define characteristics of each metric.
- Enable to organise and filter metric data based on specific attributes.
- Attributes could be resource-id, service type etc.
CloudWatch Statistics:
- Statistics of data collected from metrics of Data Points (EC2 etc).
- Examples include: Averages (min, max, samplecount etc).
CloudWatch API Metrics:
- 'GetMetricData' = Retrieve up to 500 Metrics in a single call.
- 'PutMetricData' = Publishes metric data points to CloudWatch. If it doesnt exist, it is created.
- 'GetMetricStatistics' = Get stats for specified metric, aggregates data points based on time specified (Max No. of Data Points is 1440 in single call).
Unified CloudWatch Agent:
- Used to collect internal system-level metrics for AWS and On-Prem devices.
- Can collect custom app metrics.
- Can collect logs for Windows/Linux.
- Installation process is as follows:
- Create IAM role to enable metric collection.
- install/download agent package.
- Update CloudWatch agent config file.
- Start agent.
When starting the agent, you must attach an instance profile or specify a named profile for On-Prem, or you can integrate it with Systems Manager.
CloudWatch Logs:
- Gather and centralise logs for apps and system logs.
- Define expiration policies and KMS Encryption.
- Send the logs to: S3, Kinesis Streams or Kinesis Firehose.
- Log Insights used to interactively search and analyze data.
- Create alarms based on API activity captured by CloudTrail.
- Logs are kept indefinitely (Default).
- CloudWatch logs can be used with Route 53 for DNS Queries.
Log Components:
- Events: Record or activity by monitored resource.
- Stream: Sequence of events that share same resource.
- Groups: Groups of log streams that share retention/monitoring settings.
- Metric Filters: Used to extract metric observations from ingested events and transform them to Data Points in CloudWatch Metric.
- Retention Setting: How long log events are kept in the CloudWatch Logs.
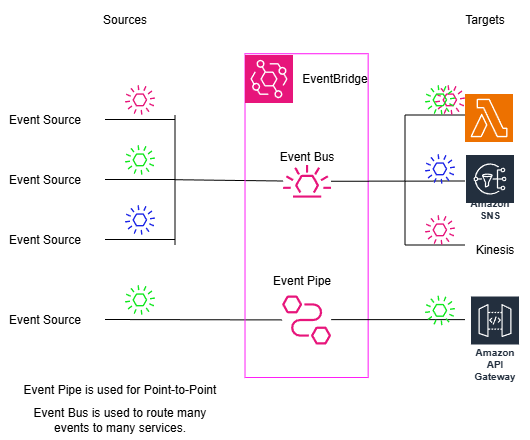
EventBridge (Formally CloudWatch Events):
- It is a serverless service.
- It helps to create Event-Driven architecture.
- Services and Applications send events to the EventBridge Event Bus.
- The EventBridge has some configured rules defined by the user.
- These rules invoke a remediation or trigger a 'Target' action.
- Common targets can be Lambda or Kinesis.